An NDVI map is useful because it tells you where the crop is behaving differently. It does not tell you why. That sounds like a small distinction, but it is the difference between using satellite imagery as a scouting tool and treating it like a prescription.
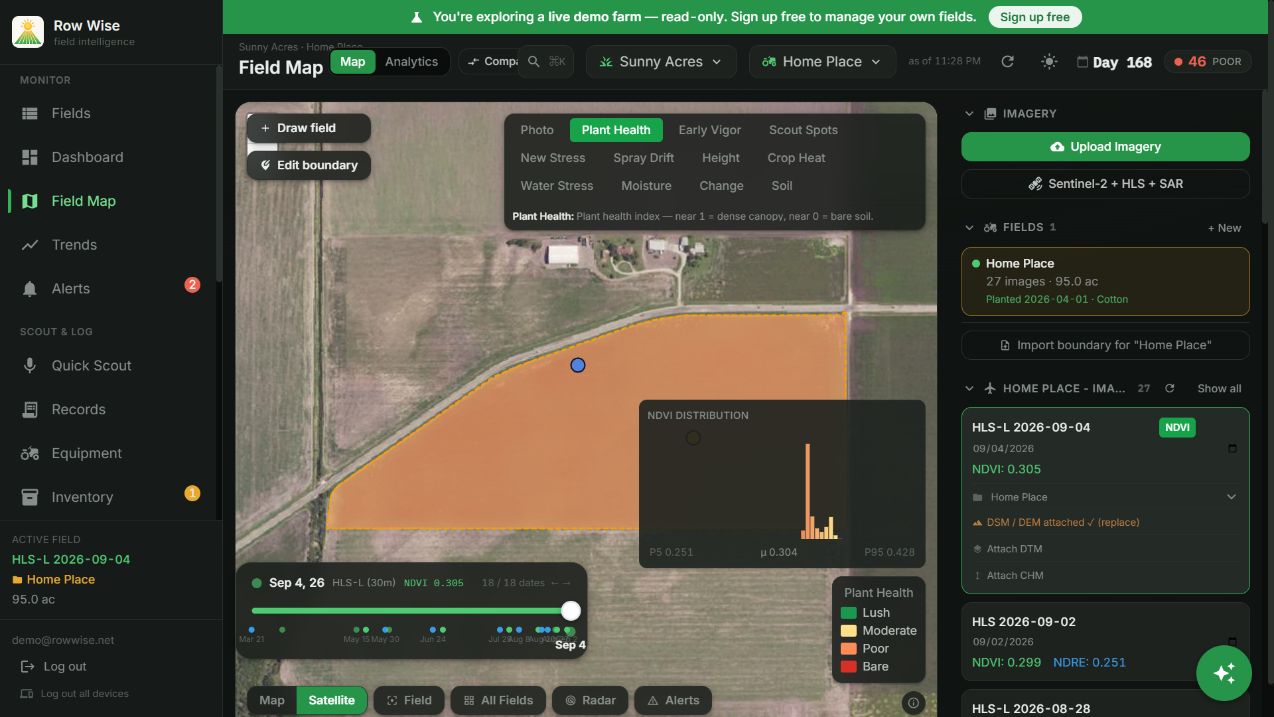
Start with the pattern, not the average
A field average can hide the part you need to see. A 95-acre field with an average NDVI of 0.30 may have one uniform stand, or it may have a strong half and a weak half. Those are different management situations even though the average is the same.
Look first for shape. Does the weak area follow a sandy ridge, a drainage path, a pivot pattern, a turnrow, or the edge of the field? A shape that matches the ground usually gives you a better first clue than the color alone.
Use the date slider before you drive
One image is a snapshot. The useful question is whether a weak patch is new, stable, or getting worse. Move back through earlier clear dates and watch the same area. If it has been weak all season, you may be looking at soil, drainage, stand establishment, or a chronic management difference. If it changed quickly, a recent weather event, irrigation problem, pest, disease, or application issue moves higher on the list.
Clouds and haze matter too. A strange edge that appears on one date and disappears on the next may be an image problem rather than a crop problem. Radar and HLS imagery help fill gaps, but they do not remove the need to check the date and source.
Then go to the field
Use the map to choose where to stop. Compare a weak area with a nearby normal area and write down what is actually different: soil moisture, plant population, compaction, insects, weeds, disease symptoms, nutrient symptoms, or storm damage. A photo and a short note are more valuable than a confident guess made from the office.
NDVI is best at narrowing the search. It helps you spend ten minutes in the right part of the field instead of an hour walking at random.
What NDVI cannot settle by itself
- It cannot reliably separate water stress from nitrogen stress without other evidence.
- It cannot identify a pest or disease from a field-scale color alone.
- It can saturate in a dense canopy, so differences late in the season may look smaller than they are.
- It should not be read as yield. Vigor and harvested yield can be related, but the relationship changes by field and season.
The sensible workflow is simple: find the pattern, compare dates, check the weather and records, then scout the spot. That is where a satellite layer earns its keep.